Course Description
Viewing design problems as a collection of decision-making processes, data has been one of the important foundations for making such decisions. This course introduces the basics of data-related methods and cutting-edge applications using a programming language for computational practice. Through examples of data generated from human activities and nature, students will learn techniques in the representation, processing, analysis, learning, and visualization of data to gain insights, communicate information, and create for the intersection of data and design. The course will include field trips depending on availability and external collaborator, and the contents are subject to change to fulfill the course objectives.
Learning Outcome
At the end of this course, students will be able to:
- Conduct data analysis and gain insights within a given context.
- Employ advanced techniques to visualize and communicate information.
- Demonstrate ability to create for the intersection of data and design.
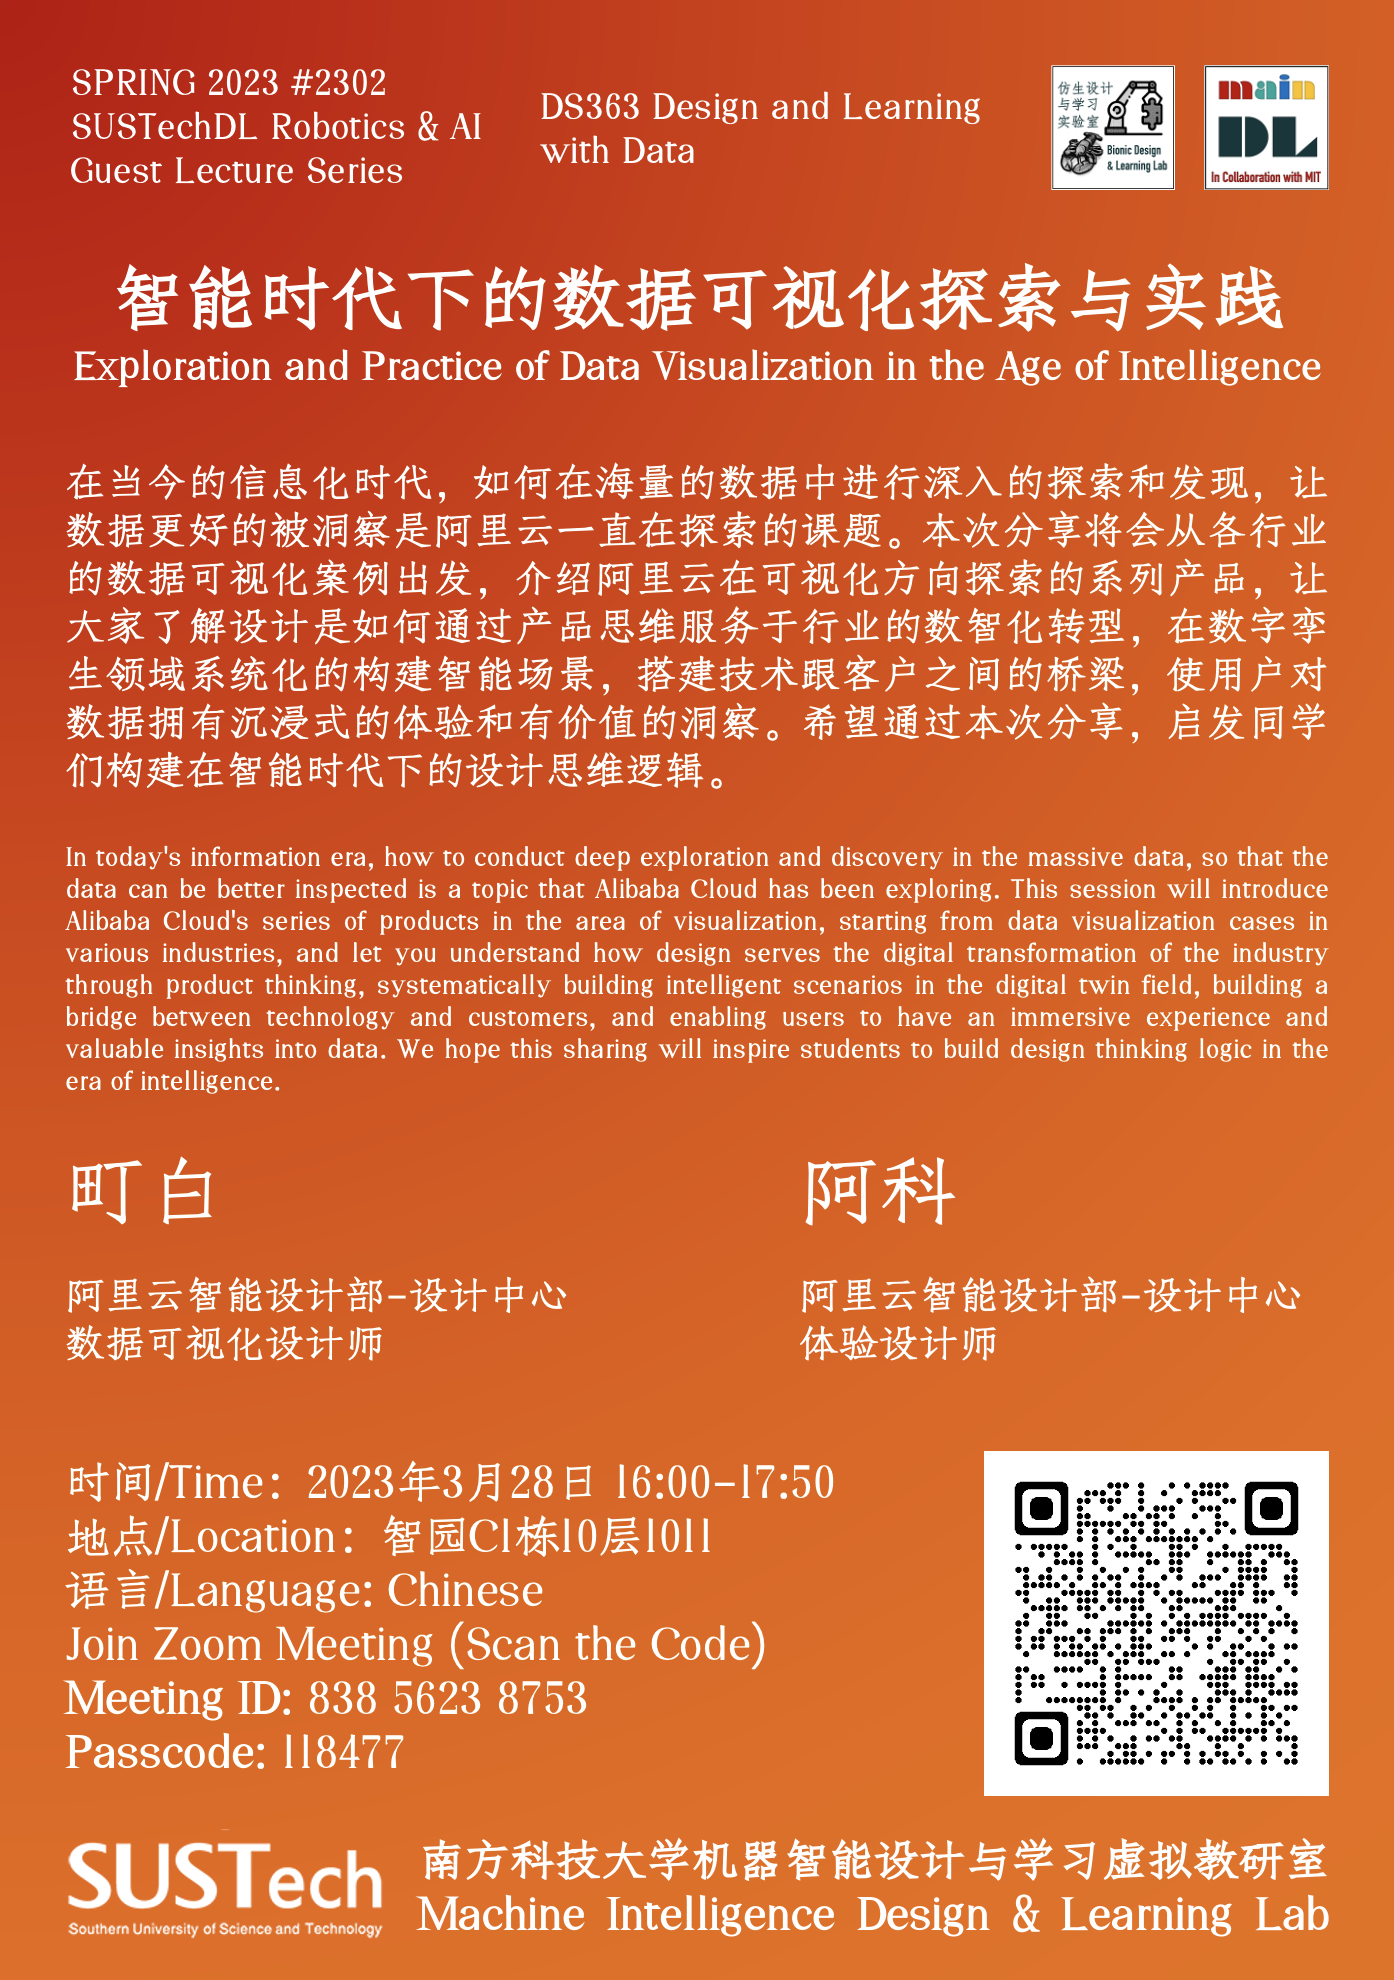
Guest Lectures

Course Instructors & Teaching Support
- Lead Instructor: Dr. Wan Fang
- wanf@sustech.edu.cn
- Tuesdays between 1400 and 1600
- Level 3, Block C1, Wisdom Park
- Teaching Assistant: Zhang Rongzheng
- 12233197@mail.sustech.edu.cn
- Office Hours: TBD
- Office Location: TBD
- Administrative Assistant: Fu Tian
Grading

- Form of examination: Letter Grading
- Grading policy:
- Attendance 10%
- Assignments 20%
- Final Presentation 70%
- All submission deadlines are Thursdays at 23:30 (late submission policy applies)
- Link to Assignment Submission
- Link to Project Submission
- Link to Course Feedback
Academic Integrity
- This course follows the SUSTech Code of Academic Integrity. This course’s students must abide by the SUSTech Code of Academic Integrity. Any work submitted by a student in this course for academic credit will be the student’s work. Violations of the rules (e.g., cheating, copying, non-approved collaborations) will not be tolerated.
Course Materials
- (2019) Data Science with Julia, Paul D. McNicholas, CRC Press.
- (2008) Handbook of Data Visualization, Chun-houh Chen, Springer
- (2015) Storytelling with Data, Cole Nussbaumer Knaflic, Wiley
- (2001) The Visual Display of Quantitative Information, Edward R. Tufte, Graphics Press
University Calendar

Lecture & Lab Notes

The course is organized into eight modules. Each module involves a combination of following sessions.
- Lecture covering the core content of the corresponding module.
- Workshop of case studies, code demonstrations, skill training, and in-class practice & discussions.
- Student presentation of the assignments or project milestones, followed by feedback and discussions.
- The tentative plan for guest lectures is also under planning, subject to change due to the guest schedule arrangement.
Module 01 on Data Literacy
Week 01
- Lecture on Tue Feb 14: Lecture Notes | Reading Materials
- Data Storytelling | Course Introduction
- (Happy Valentines Day ~~~ )
Week 02
- Lecture on Tue Feb 21: Lecture Notes | Reading Materials
- Introduction to Data | Basic Visualization of Data
- Lecture on Fri Feb 24: Lecture Notes | Reading Materials
- The Importance of Context | Design with Analytics
Notes to all students:
- Each team has 10 min for each Assignment or Project presentation.
- Please submit your presentation before the Thursdays @ 23:30.
Module 02 on Data Thinking
Week 03
- Lecture on Tue Feb 28: Lecture Notes | Reading Materials
- Concepts of Data X | Data X by Examples
Week 04
- Lecture on Tue Mar 07: Lecture Notes | Reading Materials
- Data, Narrative, Visualization | Four Types of Data Analytics
- Project Milestone Workshop on Fri Mar 10
- In-Class Presentation (Submission Deadline: Mar 09 @ 23:30)

Module 03 on Data Discovery
Week 05
- Lecture on Tue Mar 14: Lecture Notes | Reading Materials
- Data Quality Assessment | Statistical Analysis Step by Step
Week 06
- Lecture on Tue Mar 21: Lecture Notes | Case study
- Descriptive vs Inferential | Exploratory vs Explanatory Research
- Assignment 1 (10%) Workshop on Fri Mar 24
- In-Class Presentation (Submission Deadline: Mar 23 @ 23:30)

Module 04 on Information Art
Week 07
- Guest Lecture on Tue Mar 28:
Week 08
- Workshop on Tue Apr 04: Lecture Notes | Reading Materials
- Data Analysis with Python
- Workshop on Tue Apr 07: Lecture Notes | Reading Materials
- Visual Encoding Design

Module 05 on Visualizing Data
Week 09
- Project Mid-term Review on Tue Apr 11
- In-Class Presentation (Submission Deadline: Apr 10 @ 23:30)
Week 10
- Lecture on Tue Apr 18: Lecture Notes | Reading Materials
- DO and DON’T | Interaction
- Workshop on Fri Apr 21: Lecture Notes | Reading Materials
- Tableau Basics by TA (Zhang Rongzheng)

Module 06 on Story Dashboards
Week 11
- Assignment 2 (10%) Workshop on Tue Apr 25
- In-Class Presentation (Submission Deadline: Apr 25 @ 16:20)
Week 12
- Lecture on Tue May 02: Cancelled due to National Holiday
- Workshop on Fri May 05: Lecture Notes | Reading Materials
- Advanced Charts in Tableau by TA (Zhang Rongzheng)

Module 07 on Data Storytelling
Week 13
- Lecture on Tue May 09: Lecture Notes | Reading Materials
- Data Driven Design | A/B Testing
Week 14
- Guest Lecture on Tue May 16
- Zhong Xiang
- Lecture on Fri May 19: Lecture Notes | Reading Materials
- Uncertainty
Module 08 on Impact with Data Storytelling
Week 15
- Guest Lecture on Tue May 23
- Zhou Jian
Week 16
- Lecture on Tue May 30: Lecture Notes | Reading Materials
- Ethical and Deceptive Visualization
- Final Project Presentation (70%) Workshop on Fri Jun 02
- In-Class Presentation (Submission Deadline: Jun 01 @ 23:30)
Final Project
For this semester, the final project will involve three elements to be reflected in data-driven storytelling.
- Theme: tù
- You are free to choose any data or topic you would like to, as long as you can justify its relationship to the theme of tù. Note that reflecting the connection between your final presentation content and submitted files is not entirely necessary. Still, you would need to provide a brief written justification of how your final project relates to the theme.
- Based on the lunar calendar, the year 2023 is the year of rabbit, pronounced as tù in Chinese. It is a common animal that is sensitive to environmental changes. It is also a lovely pet that comforts the heart of many. It also presents unique economic values as a stock animal where people use its furs for production or its meat for food. They are the common characters in many Eastern and Western cultures that provide a rich collection of literature, mythical stories, and even holidays.
- Three English words share a similar pronunciation: to, too, and two. You can choose anything with two exciting aspects, which is common in almost every corner of our lives. You can also choose any process of change from one state to another. Or you can choose to reflect something of similar features, too. The dictionary offers many meanings and inspirations, which is a good place to start.
- You are expected to organize your perspective of a data-driven story related to the theme by providing a written justification within 250 words to elaborate on the idea. And then, use what you learn from this course to find the data, conduct the analysis, organize the logic, and visualize the story in your final project. If you have any questions, contact the Lead Instructor for a chat.
- You are free to choose any data or topic you would like to, as long as you can justify its relationship to the theme of tù. Note that reflecting the connection between your final presentation content and submitted files is not entirely necessary. Still, you would need to provide a brief written justification of how your final project relates to the theme.
- Format: PacificVis Contest
- “PacificVis is an IEEE sponsored international visualization symposium held in the Asia-Pacific region, with the objective to foster greater exchange between visualization researchers and practitioners, and to draw more researchers in the Asia-Pacific region to enter this rapidly growing area of research.” The full name is IEEE Pacific Visualization Symposium.
- Conference Website: https://pvis2023.github.io/pvis2023/
- The PacificVis Contest is a special event during the conference. “This contest aims to encourage students, researchers, and visualization practitioners to demonstrate the value of data visualization through compelling visual data stories and to promote innovative and effective use of data visualization for communication and presentation.”
- Conference Website: https://visstory.github.io/
- For your final project, besides the theme of tù, you will follow the contest guidelines to better prepare your data-driven story in terms of detailed requirements, files, format, etc. It would be best if you went through the above link to learn more about it. And there is also a rich collection of winning examples of various formats from previous years for your reference.
- Your final submission includes the same required submission materials for the official contest, which generally include:
- 1) Your data-driven visualization file (which may take several forms, as explained on the official contest website)
- 2) a 4:55 min recorded video explanation of your submission. (note that this video is only about your visualized story with data, which is different from the final presentation to be explained below.)
- Each team is required to submit an MP4 video of the slides with a resolution of 1280×720 preferred. This will enable us to load all talks onto the same laptop without configuration or format issues while allowing presenters to use whatever graphics or video tools they choose to generate the presentation. Presentations should be limited to 4 minutes and 55 seconds, with the next speaker’s video starting automatically at the 5-minute mark. If your video is longer than 4:55, it will be truncated.
- 3) all reproducible and shareable codes, data, and files to generate your final submission.
- Your final submission includes the same required submission materials for the official contest, which generally include:
- Although we won’t be able to join the contest for 2023, if you are keen to participate, you are encouraged to use this semester’s learning as a preparation to help you better prepare for the contest, which you may consider participating in the January of 2024. For this course, each student is expected to form a team of your own for the final project. By completing this course, you may consider forming a bigger team to refine your data-driven visualization and storytelling for joining the contest. Your decision to participate or not will have no impact on your markings for the final project. If you have any interest or questions regarding participating in the contest, please also contact the Lead Instructor for a chat.
- “PacificVis is an IEEE sponsored international visualization symposium held in the Asia-Pacific region, with the objective to foster greater exchange between visualization researchers and practitioners, and to draw more researchers in the Asia-Pacific region to enter this rapidly growing area of research.” The full name is IEEE Pacific Visualization Symposium.
- Live Presentation and Demonstration: Week 16
- Finally, you are expected to present your data-driven storytelling through visualization of your final work in Week 16 through a live presentation and demonstration. For visualizing your final project, below are a few tools that you might find helpful. Please note that you are not limited to the specific tool for your final visualization, but you are expected to learn it on your own to be skilled at using them or enhance your final submission.
- The simple choice:
- PowerPoint & Excel
- For code-intensive users:
- Visualization specific tools
- The simple choice:
- Conduct a ~10 mins presentation regarding how your data-driven story is developed throughout this semester.
- In this presentation, you are expected to
- 1) briefly explain how your final project is related to the theme of tù,
- 2) explain your iterative development and feedback during development,
- 3) play the short ~5 mins video recording of your storytelling, and
- 4) a live demonstration of your data-driven story visualization.
- Finally, you are expected to present your data-driven storytelling through visualization of your final work in Week 16 through a live presentation and demonstration. For visualizing your final project, below are a few tools that you might find helpful. Please note that you are not limited to the specific tool for your final visualization, but you are expected to learn it on your own to be skilled at using them or enhance your final submission.